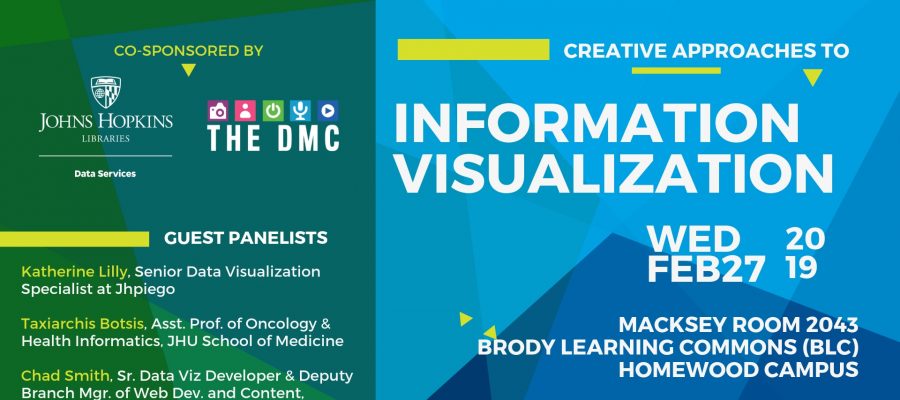
Creative Approaches to Information Visualization

A Joint Collaboration between the Digital Media Center and the Johns Hopkins University Library Systems, this event seeks to provide inspirational presentations discussing use cases for using information visualization techniques and tools from three panelists:
- Katherine Lilly (Senior Data Visualization Specialist at Jhpiego)
- Taxiarchis Botsis (Assistant Professor of Oncology and Health Informatics, Johns Hopkins University School of Medicine)
- Chad Smith (Sr. Data Visualization Developer and Deputy Branch Mgr. of Web Development and Content, Space Telescope Science Institute)
This event will be on Wednesday, February 27, 6:00 – 7:30pm at Macksey Room, Brody Learning Commons (BLC).
Light refreshments will be provided. Co-sponsored by the Digital Media Center (DMC) and JHU Data Services.
Register at bit.ly/2E6RScs
Find more data on our panelists below:
Katherine Lilly, Senior Data Visualization Specialist at Jhpiego
Katherine works in the first-ever data visualization role created by Jhpiego, an international health organization based in Baltimore. She has produced infographics, dashboards, and static and interactive data visualizations for over 30 health projects in Africa and Asia, including USAID’s $500 million flagship Maternal and Child Survival Program. Katherine works with field-based and headquarters teams to build capacity in data visualization so that health data collected is understandable and actionable by health workers, managers, and Ministries of Health. She received her MPH from Johns Hopkins Bloomberg School of Public Health and is currently pursuing a Master’s in Information Visualization from Maryland Institute College of Art.
Taxiarchis Botsis, Assistant Professor of Oncology and Health Informatics, Johns Hopkins University School of Medicine
Dr. Botsis’ background lies in the field of Medical Informatics with particular interest in the natural language processing of clinical texts and the development of efficient infographics in biomedicine. He is currently leading a project that will deliver a Decision-support Information Visualization Platform to the Safety Evaluators at the US Food and Drug Administration. Dr. Botsis recently completed a Masters of Professional Studies on Information Visualization at the Maryland Institute College of Art. His thesis focused on the construction of a 3D installation art piece to show how the genomic fingerprint of lung cancer shapes response to immunotherapy.
Chad Smith, Sr. Data Visualization Developer and Deputy Branch Mgr. of Web Development and Content, Space Telescope Science Institute
Chad graduated from the Maryland Institute College of Art in 2015 with a Master’s in Information Visualization. As a person who loves the intersection of technology, art, and science, Chad dedicated his thesis to these three things. The result was WebbVR, a fully-immersive, interactive, and information rich public outreach product for the field of astronomy, focused on the James Webb Space Telescope. As Chad looks to the future, he continues to seek new and innovative ways to allow the public to engage and explore the universe around them.
Tags: data, library, panel, visualization
