2018 Needs Assessment
Posted: April 22, 2019
From September – November 2018, LGBTQ Life conducted a survey to learn more about lesbian, gay, bisexual, transgender, queer, and allied students at Johns Hopkins University.
We encourage all members of the JHU community to learn more about the needs of LGBTQ students. You can read our PDF Document: summary report here, or contact us to learn more about what we found and how you can help support this community.
430 students participated in some part of the survey, with representation from every school that makes up Johns Hopkins University.
Key findings
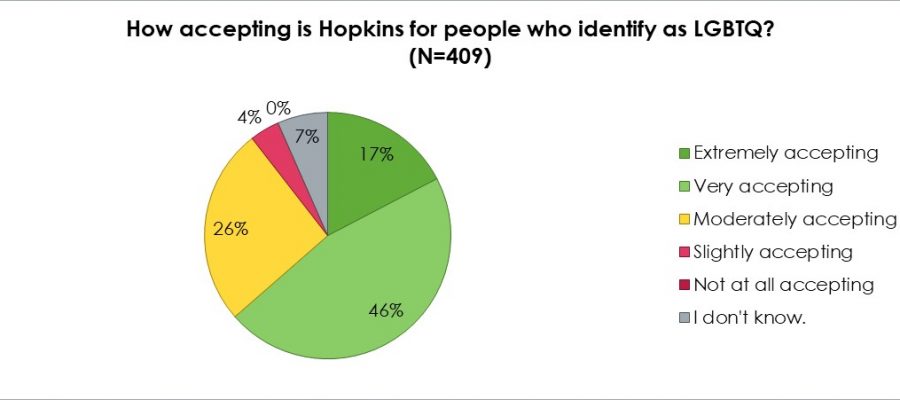
- 63% of participants rated Hopkins as very or extremely accepting for LGBTQ people.
- 43% never or rarely saw mentions of transgender support.
- 23% of participants said they often or always saw positive depictions of LGBTQ identities in the classroom.
- 54% of LGBTQ participants said they often or always feel that they belong at Hopkins.
- 24% of LGBTQ participants had experienced verbal harassment due to their identities in the past semester.
- 49% of LGBTQ participants were not out to a single staff or faculty member at Hopkins.
- LGBTQ participants (and trans people specifically) had more negative responses on measures of campus climate and wellbeing.
- LGBTQ people of color are less likely to be out on campus and with family.
Recommendations
Based on the results, we created five recommendations for the campus community. We will work on these priorities over the 2019-2020 year.
- focusing on intersecting identities
- providing more resources beyond Homewood
- creating more visible support
- including LGBTQ communities in the curriculum
- increasing the number of all-gender restrooms